Computer Science 252
Neuromorphic Computing
Assignment 1: NumPy, Matplotlib, and the Dot Product
Objectives
- Gain experience using NumPy and matplotlib, the Python packages that have largely replaced Matlab in the neural network community.
- Use NumPy to implement the dot product operation that is at the heart of most neural-net algorithms.
- Understand why we use NumPy to do this, instead of using the explicit for loops you learned in CSCI 111.
I’ve broken down the assignment into parts to make it easier, but you’ll submit everything in a single Python script when you’re done. In my own solution I put a print() statement indicating each part, and I encourage you to do this same.
If you’re new to NumPy and matplotlib, remember: GIYF. There’s likely a good example on stackoverflow.com of how to do what you want to do, such as overlaying multiple plots. I will typically put a comment in my code with a link to the page that helped me in cases like this, and I encourage you to do the same. If you have any concerns about Honor System issues relating to this kind of coding, feel free to ask me.
Part 1: Roll your own
To get started, create a Python script called dotprod.py. This script should perform the following action. Each action should be preceded by a print statement to let the user know what’s going on.
- Create two lists of 1000000 (one million) elements, made by calling random.random() in a list comprehension Since you’re doing this more than once, you should write a function for it.
- Write a function to compute the dot product of the two lists. Print out the result.
- Does the result make sense? Add a print statement saying what you expected the result to be, and why.
- Use time.time() to compute the time taken by your dot-product function. (Call it once immediately before, storing the current time in a variable. Then call it again immediately after, subtracting the stored time value from the new current time).
Part 2: My name is NumPy, pronounced with an umPy …
Now we’re going to repeat what we did in Part 1, but this time with NumPy. So in your dotprod.py script add some code to do the following:
- Convert each of your two lists into a NumPy array, using numpy.asarray()
- Use numpy.dot() to compute the dot product of these two arrays. Report the result (which should be the same as in Part 1, to several decimal places), and the time taken as you did above (which should be much shorter). The convention in the NumPy community is to abbreviate this by doing import numpy as as np at the top of your script, then calling np.dot() later.
Part 3: Speed trials and matplotlib
This part will be the most complicated, but will make use of things you already did in the first two parts. You’re going to compare the time taken by the two approaches (roll-your-own loop against numpy) for different sizes of very large arrays.
- Start with three empty numpy arrays. One array will hold time values for your roll-your-own dot product, another will hold time values for np.dot(), and a third will hold the size of the dot product being computed (see next step).
- Create a for loop to step from some large number of values to some even larger number, in large increments. For my solution I started at 1000000 (one million) values and stepped through 10000000 (ten million), inclusive, in increments of 1000000 (one million).
- For each such number, repeat steps 1 and 2 above; i.e., time your own version of dot product and then np.dot(). But now, append each timing result to the appropriate array (initially empty), using np.append(). Google numpy append for the syntax, which is different from that of standard Python arrays.
- Once you’ve got your two timing arrays, use matplotlib.pyplot.plot() to create a plot of each, followed by matplotlib.pyplot.show() to display your plot. The convention in the matplotlib community is to abbreviate this by doing import matplotlib.pyplot as plt at the top of your script, then calling plt.plot(), plt.show(), etc.
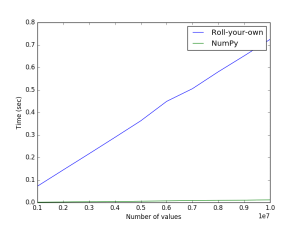
- Annotate your plot with axis labels and a legend, using plt.xlabel(), plt.ylabel(), and plt.legend(). You should get something like the figure below.
What to turn in to github
For this assignment, submit just your dotprod.py file. I am going to test this program as follows, from the command-line in a terminal window (I’m using % to indicate the command-line prompt):
% python3 dotprod.py
If your program contains a syntax error or runtime error, you will get a zero on this assignment. So, if you’re smart, you’ll set aside an extra few minutes to download your sakai submissions as test them as above.